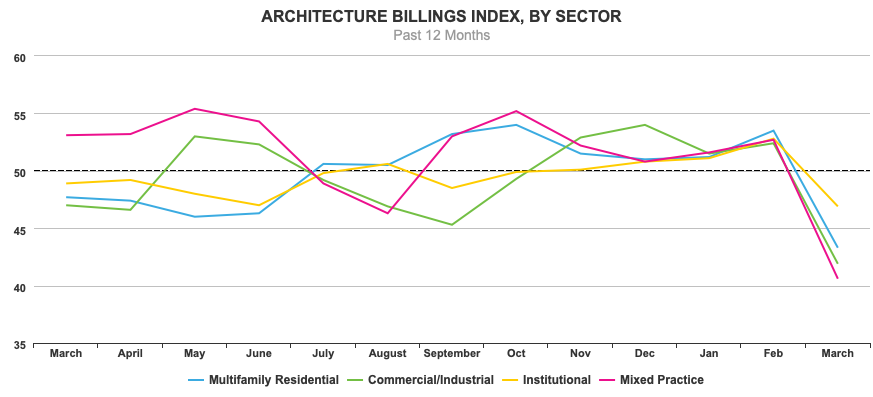
AIA’s monthly Architecture Billings Index for March came in at a score of 33.3, a dramatic 20.1-point decrease from February’s score of 53.4, reflecting the deteriorating economic conditions caused by the COVID-19 pandemic. The ABI is a leading economic indicator of construction activity in the U.S. and reflects a nine- to 12-month lead time between architecture billings and construction spending nationally, regionally, and by project type. A score above 50 represents an increase in billings from the previous month, while a score below 50 represents a contraction.
“Though most architecture firms have made quick transitions to remote operations, the complete shutdown of business activity is severely impacting architects,” said AIA chief economist Kermit Baker, Hon. AIA, in a press release. “The dramatic pullback in new and ongoing design projects reflects just how quickly and fundamentally business conditions have changed across the country and around the world in the last month as a result of the COVID-19 pandemic.” Design contracts also fell precipitously last month, with a 24.9-point decrease to a score of 27.1.
The scores for regional billings—which, unlike the national score, are calculated as three-month moving averages—fell in the four regions in March with all regions reporting scores below the threshold of 50. Billings in the Midwest fell 9.4 points to a score of 44.2, while billings in the South fell 13.8 points to a score of 44.2. Billings in the West fell 4.5 points to a score of 45.3, while billings in the Northeast fell 11 points to a score of 38.4.
Billings scores also fell in all four individual industry sectors, with all sectors falling below the threshold of 50. The commercial/industrial sector fell by 10.5 points to a score of 41.9. The institutional sector decreased by 5.9 points to a score of 46.9. The multifamily residential score fell by 10.2 points to a score of 43.3. The mixed practice sector decreased by 12.1 points to 40.6. (Like the regional billings scores, sector billings scores are also calculated as three-month moving averages.)


